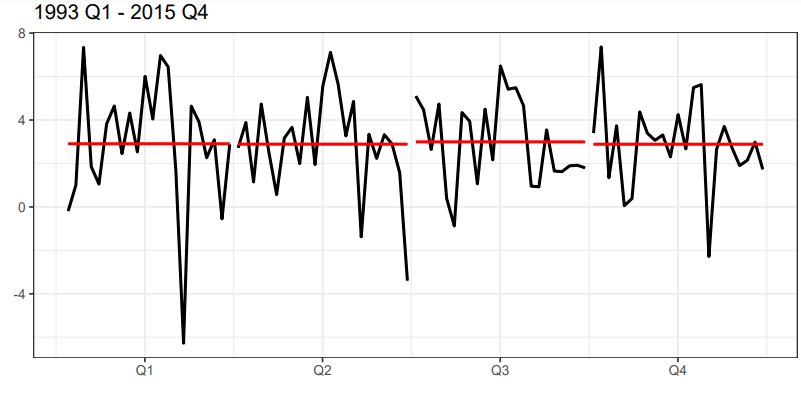
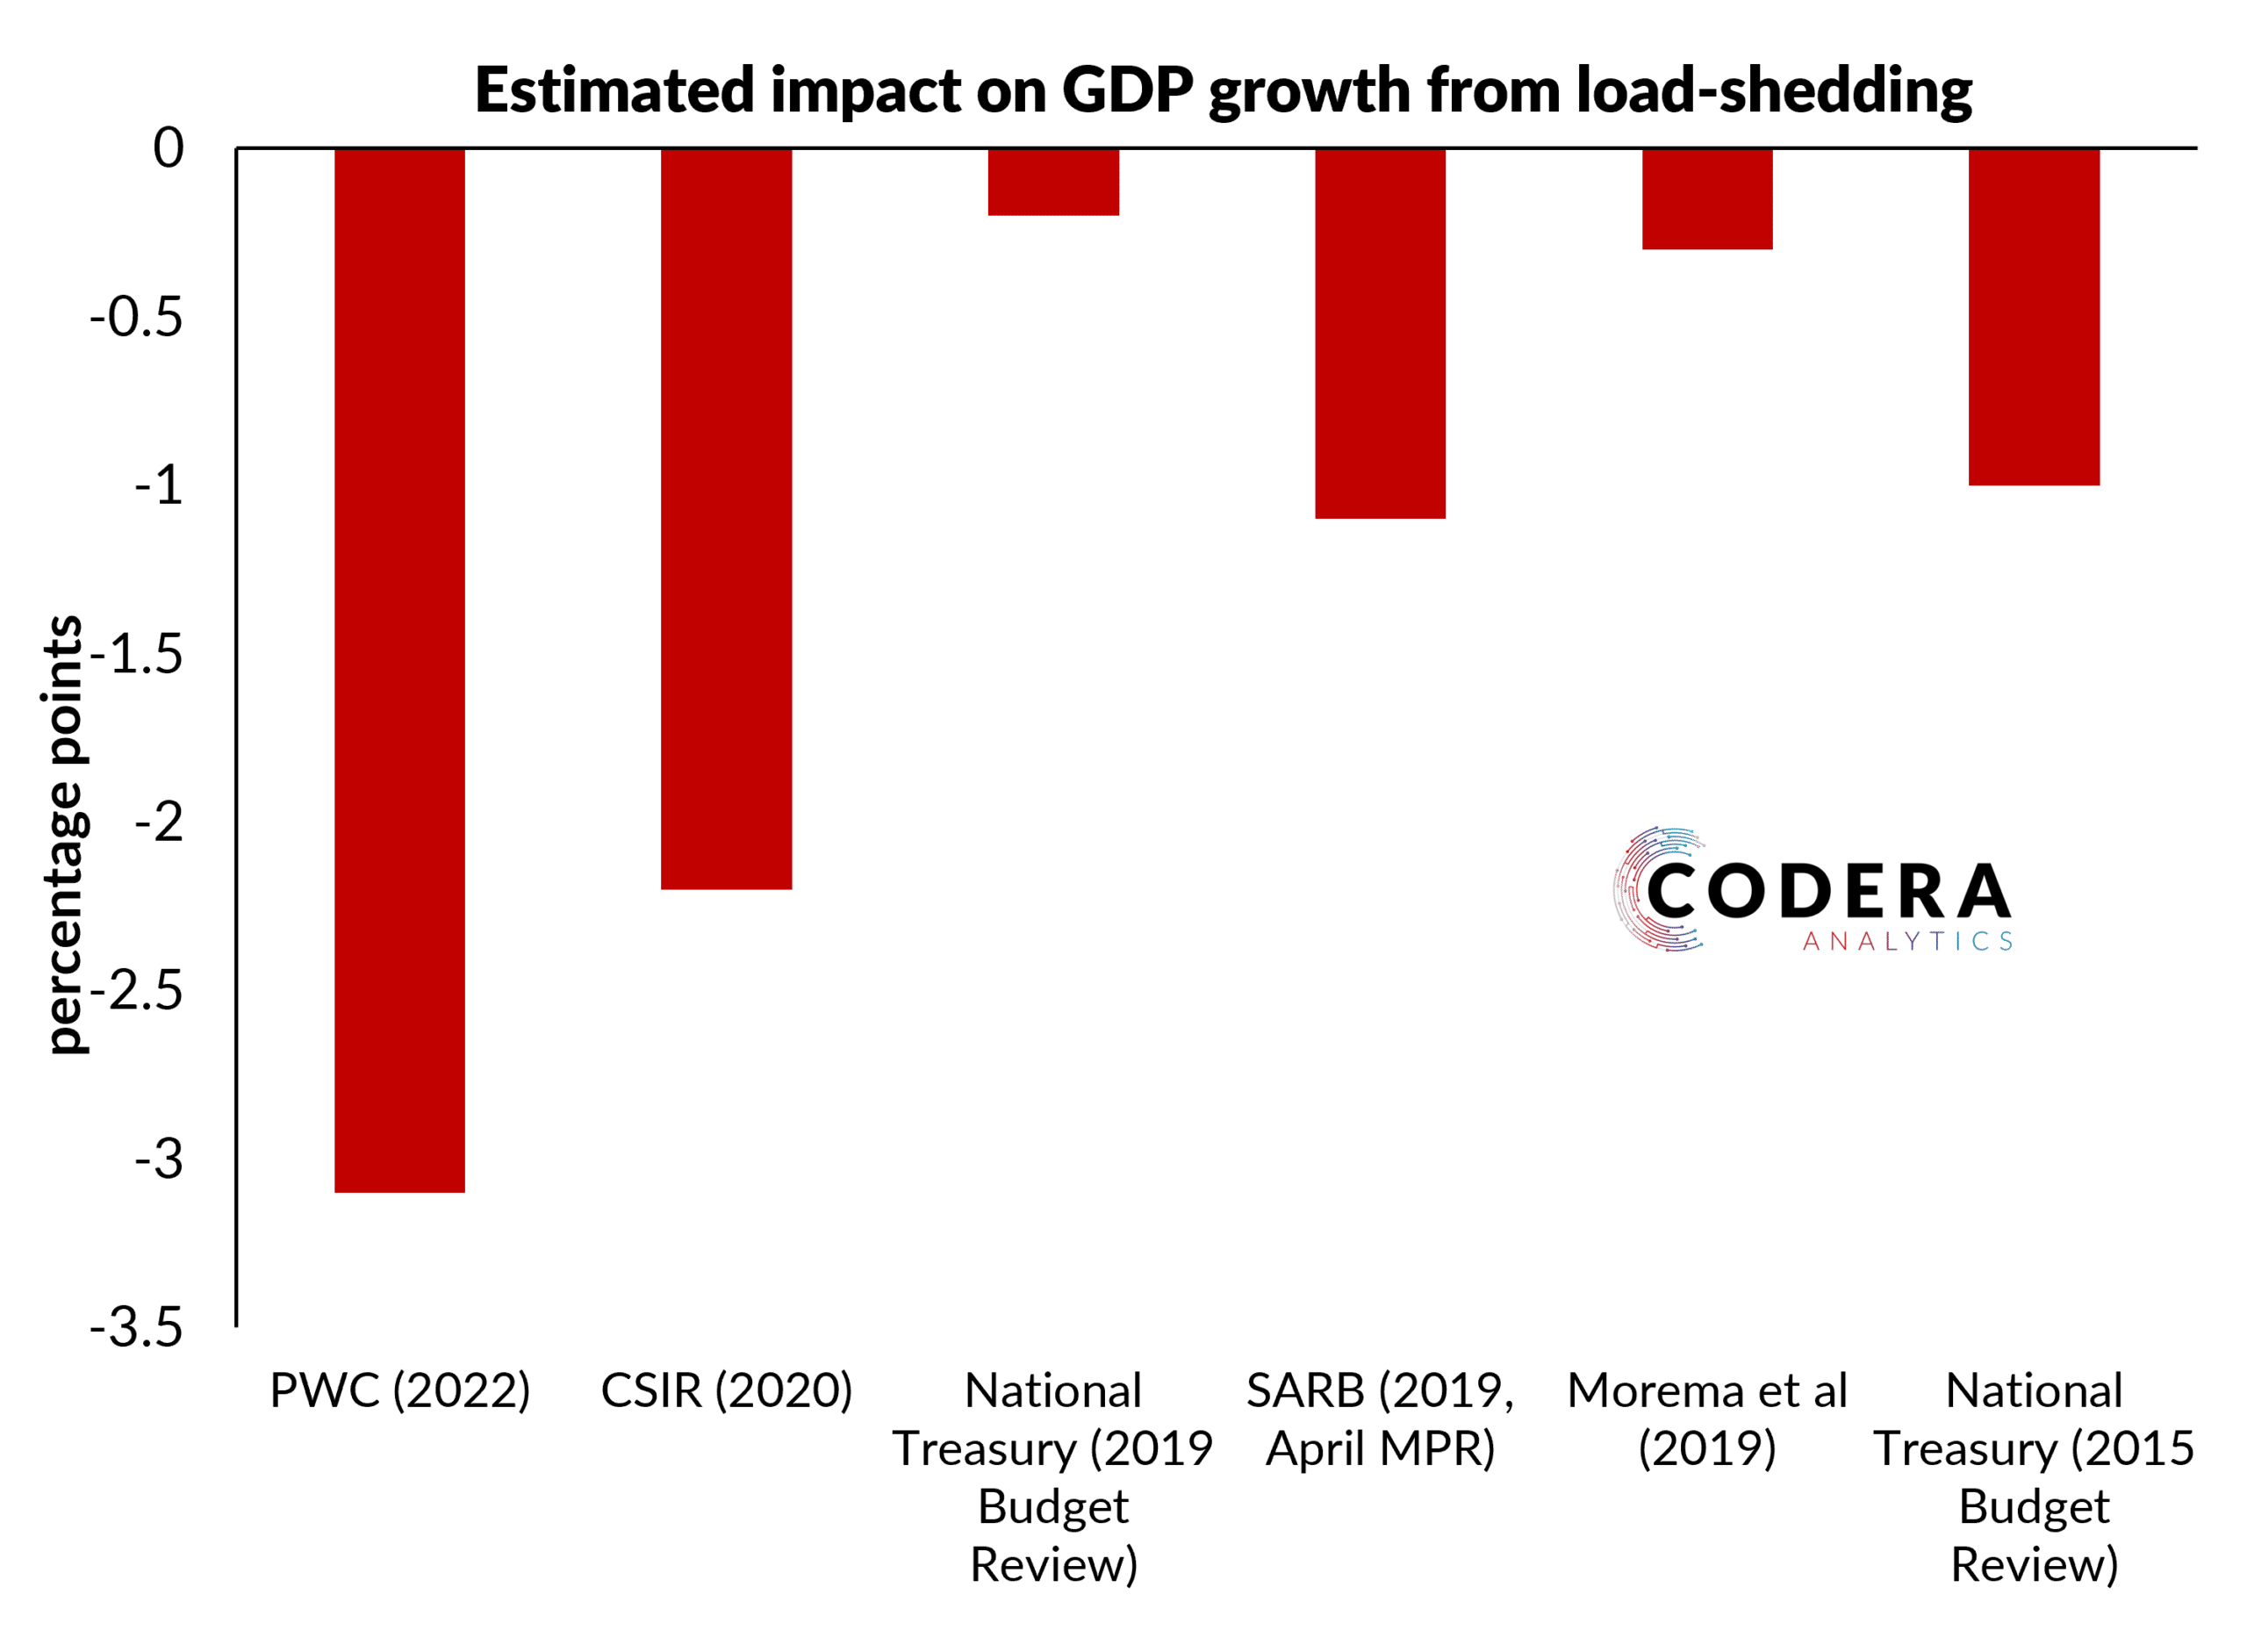
Estimates of the GDP growth impact of load-shedding range between -0.2 and -3.1 percentage points. It is difficult to compare estimates of load-shedding impacts because of differences in assumed electricity production losses and assumed economic costs of electricity shortages. The chart and table below summarise recent estimates from a variety of sources and the basis of their calculation.
| Source | Estimated impact on GDP growth (percentage points) | GDP lost (R million per day) | Description |
| PWC (2022) | Up to -3.1 in 2022 | Reduction to real GDP growth, costing the economy up to 400,000 potential jobs. | |
| Western Cape Government (2021) | 500 per stage | ||
| Eskom (Nova, 2021) | -0.4 | 236 in stage 1 to 942 in stage 4 | Growth sensitivity to a 1% Load-shedding increase (as % of electricity sales). |
| Eskom (Nova, 2020) | R35 billion total cost to the economy between 2007 and 2019 in constant 2020 prices. | ||
| CSIR (2020) | -1.1 to -2.2 in 2019 | 700 per stage | Total cost of between 167 to 388 billion between 2007 to 2019, which is equivalent to around 0.3 to 0.7 of cumulative GDP since 2007. Costs in 2019 estimated at between 60 and 120 billion. |
| National Treasury (2019, Budget Review) | -0.2 in 2019 | Estimated decline in GDP growth from expected decline in energy availability in 2019. | |
| SARB (2019, April MPR) | -1.1 in 2019 | Growth impact relative to baseline 2019 forecasts. Employment loss estimated by 125 000 jobs. | |
| Morema et al (2019) | -0.3 in 2019 | 348 in stage 1 to 753 in stage 4 | Assuming load-shedding continued throughout 2019. |
| Goldman Sachs (2019) | -0.9 in 2019 | Estimated decline in GDP growth if load-shedding persisted throughout 2019. | |
| RMB Morgan Stanley (2019) | -0.5 | Growth sensitivity to a 10% power supply cut (annualised). | |
| National Treasury (2015, Budget Review) | -1 in 2015 | Estimated real GDP growth impact of electricity shortages in 2015. |