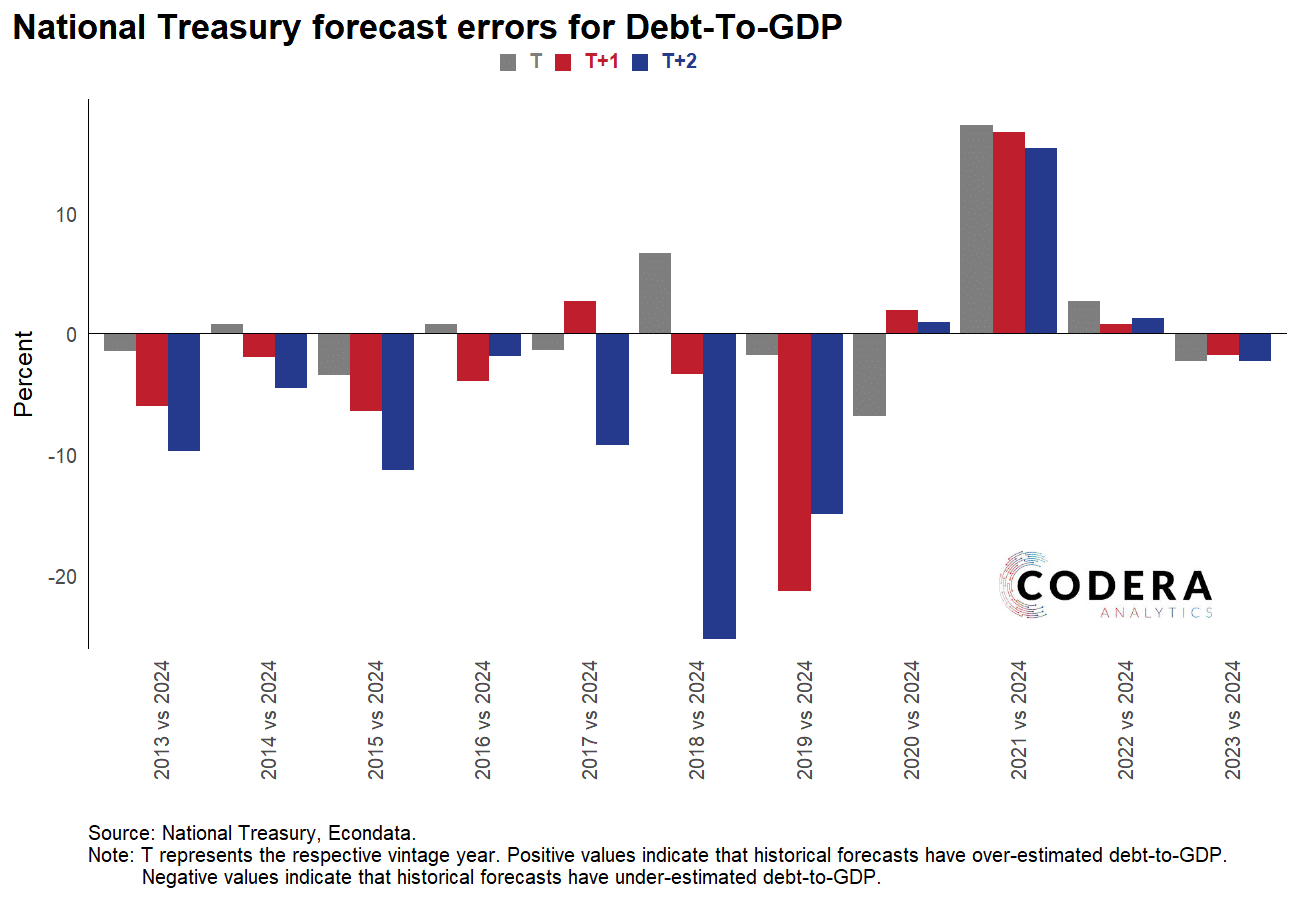
EconData makes it easy to evaluate historic SARB and National Treasury forecast errors and data revisions. National Treasury has tended to under-estimate the medium-term debt profile over the last decade. Today’s post plots the difference between projected debt to GDP ratios to updated historical figures from the Treasury’s latest budget. The largest debt profile forecast errors were in the 2018 and 2019 Budget Reviews. From 2021 onwards, upward revisions to the level of South Africa’s GDP helped to lower the debt profile, leading to large positive forecast errors in the Budget Review 2021 figures.
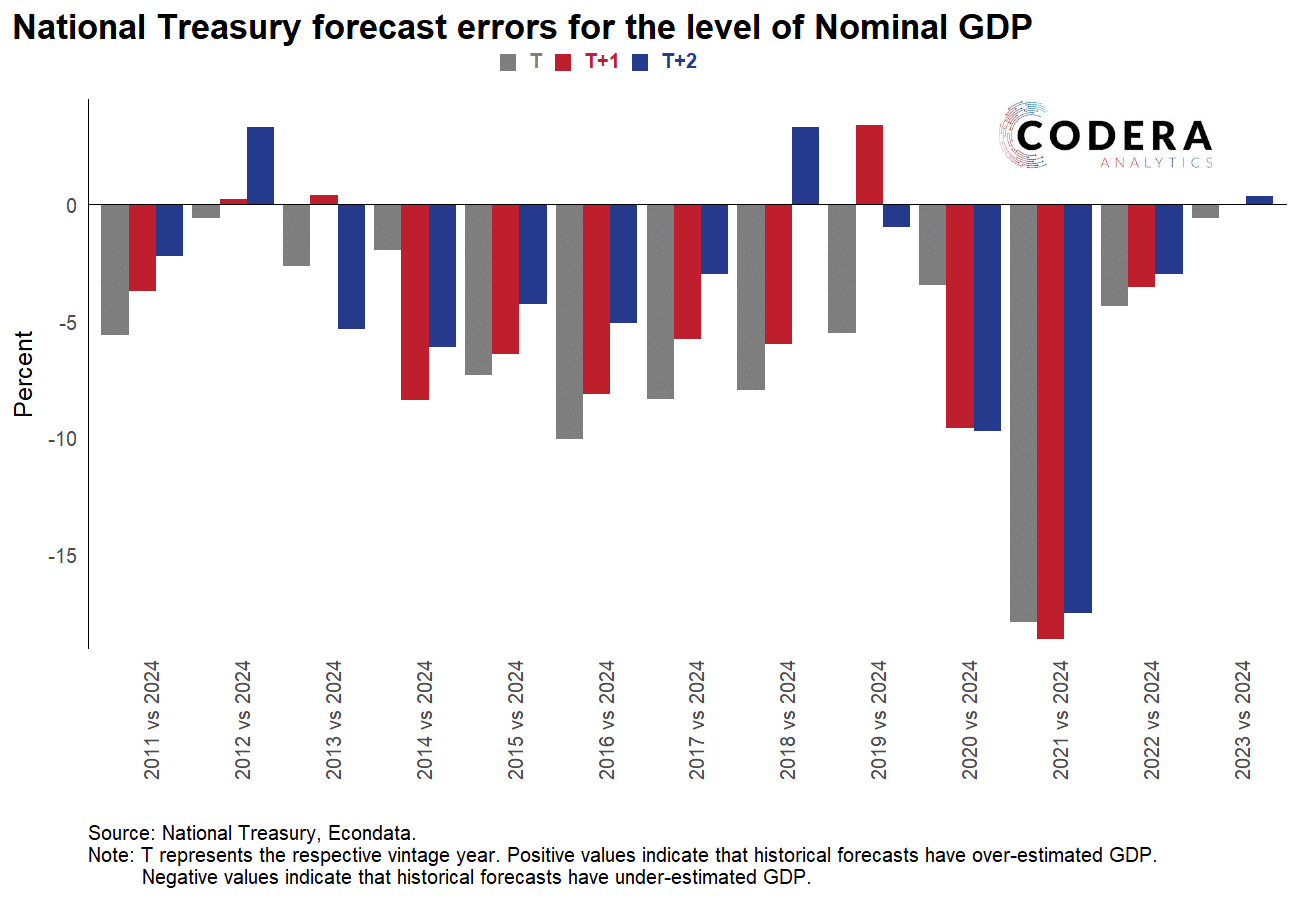
To be fair to Treasury, most forecasters over-estimated growth after the Global Financial Crisis. Both the SARB and the IMF have ratcheted down their trend GDP projections over time in response to successive growth disappointments, although the IMF have had a slightly more pessimistic view of the potential growth rate of the economy since the COVID-19 pandemic.
Compiled by Lisa Martin

