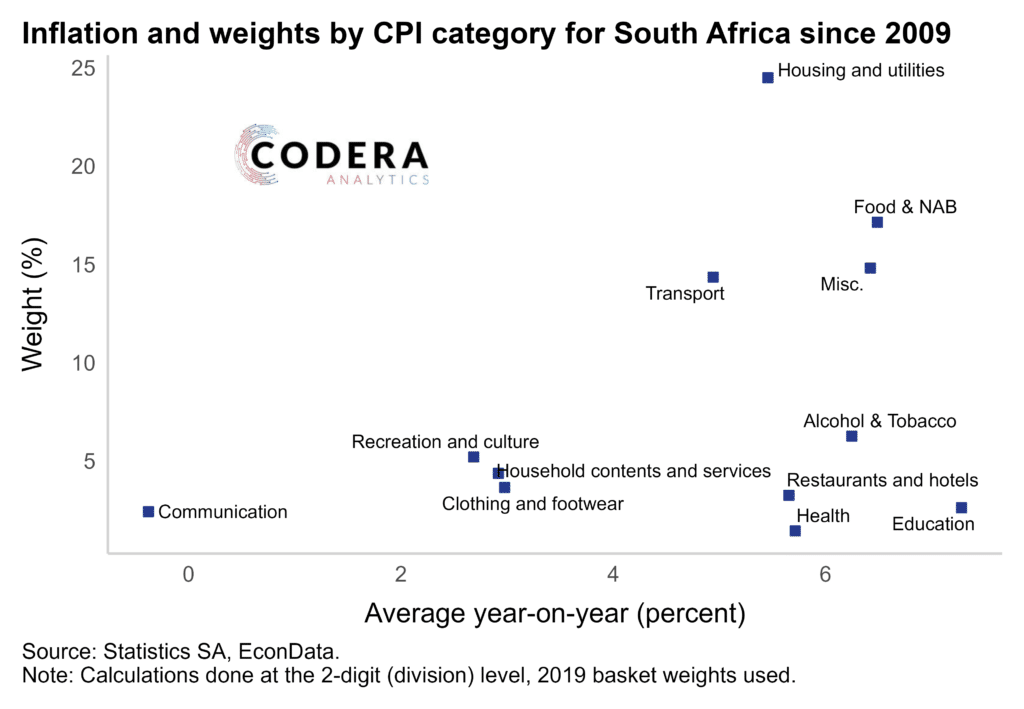
Today’s chart of the day plots CPI division inflation rates and CPI weights. Many analysts focus on a 2-digit level, where there are 12 expenditure categories, including, for example food and non-alcoholic beverages (NAB). At this level, food and beverages and housing and utilities are the CPI divisions that have high weighs in the index and have experienced average inflation well above the 4.5% target. The volatility in the food category reflects the influence of global food prices, domestic weather conditions and the exchange rate, while the high average rate in housing reflects high administered price increases in electricity and water tariffs.
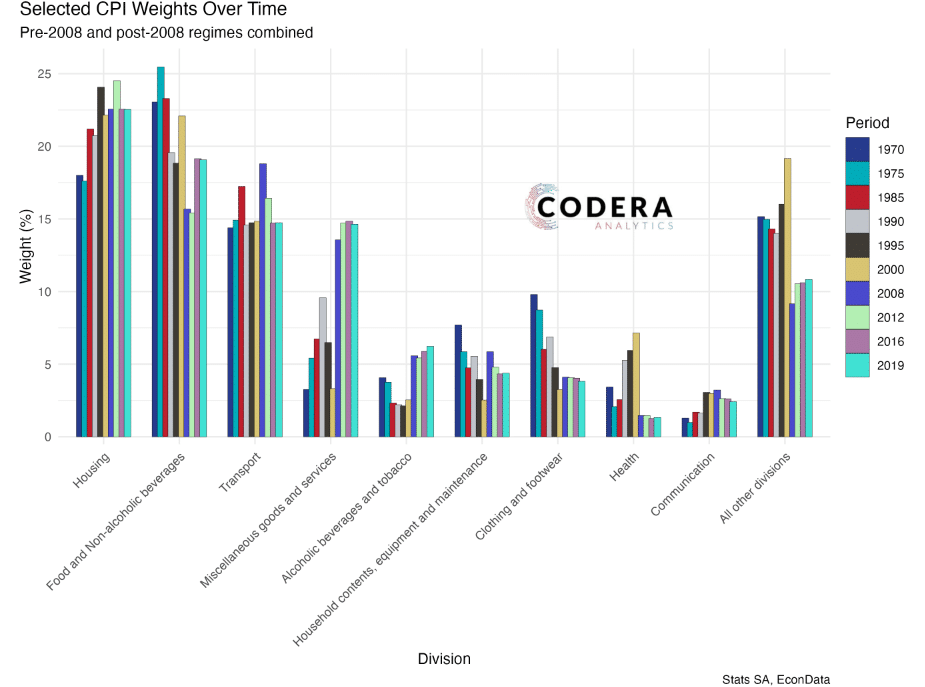
EconData makes historical CPI weights back to 1970 available on the website, in excel, R or Python.
Compiled by Lisa Martin