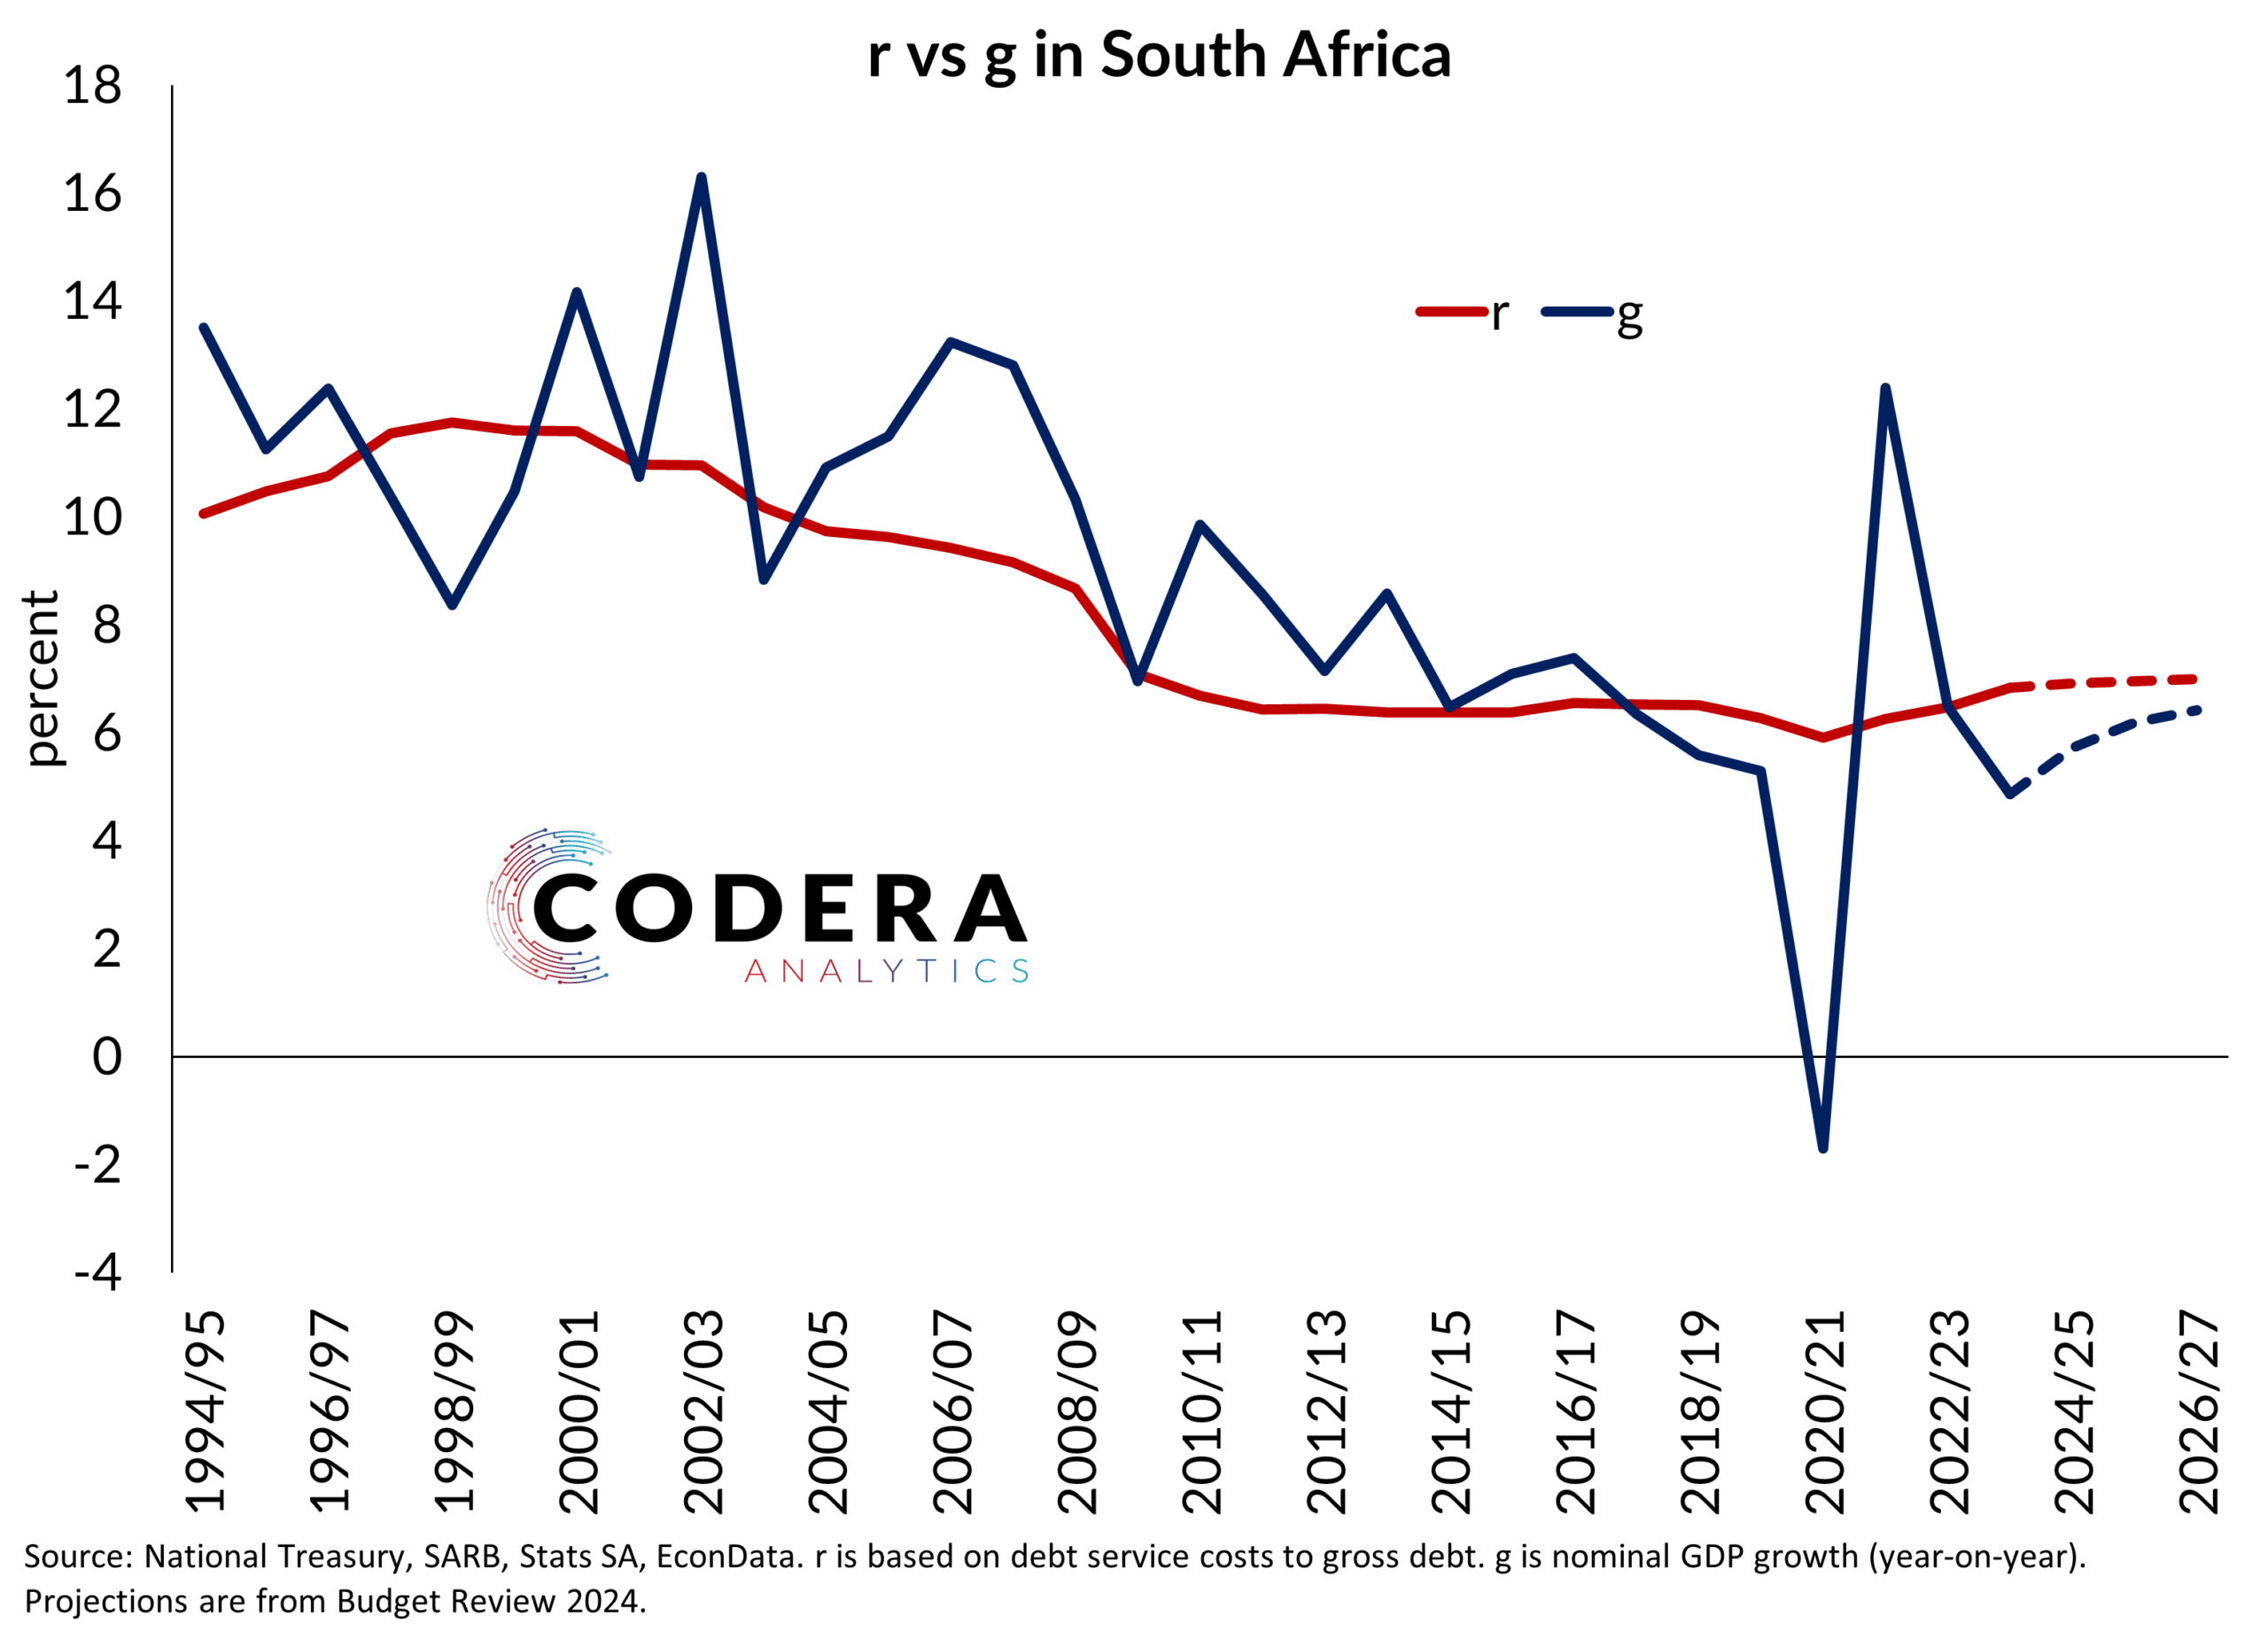
A short hand economists use to think about the outlook for public debt is that government debt tends to rise when borrowing costs are higher than economic growth (r > g). Low global interest rates following the global financial crisis (GFC) helped to bring down the cost of funding borrowing for government. But rising public debt has seen government’s debt service costs rise, nearly doubling as a percentage of GDP since the GFC. Our EconData platform makes it easy to access historical National Treasury Budget projections. Contact us if you are interested in subscribing to subscriber-only datasets such as the Public Finance Module.
Footnote
It is important to note that there are many different ways to measure r and g, see here and here for some alternatives for South Africa. These alternative measure show that for more than a decade, r has been higher than g in South Africa. The opposite has been true in economies such as Australia, Canada, China, India or the United States, particularly before the COVID-19 pandemic.