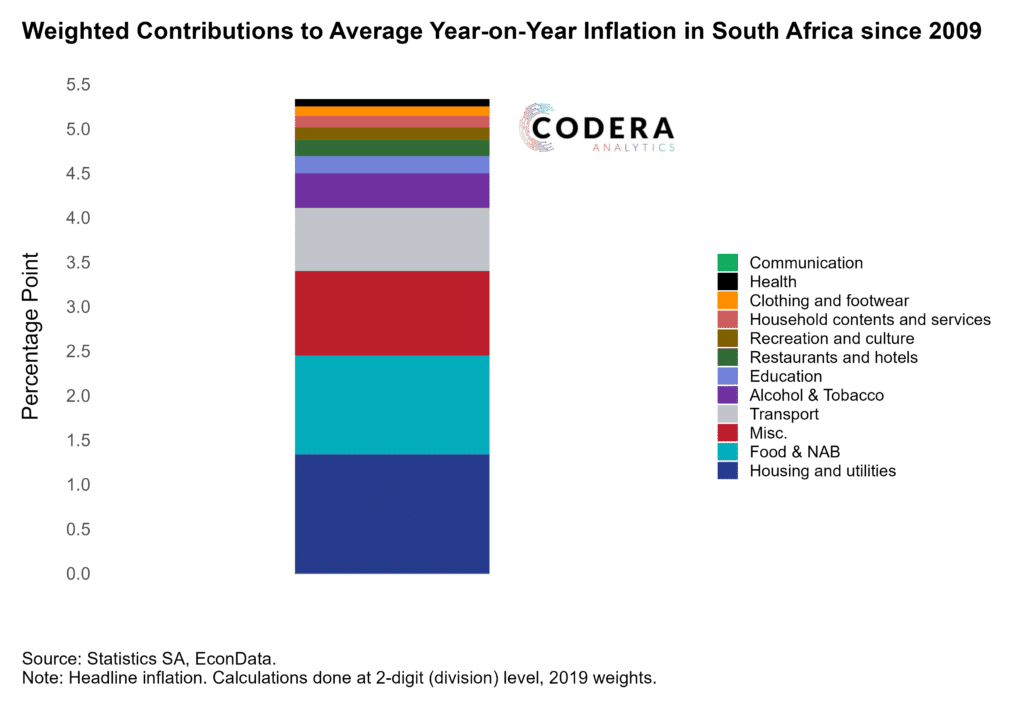
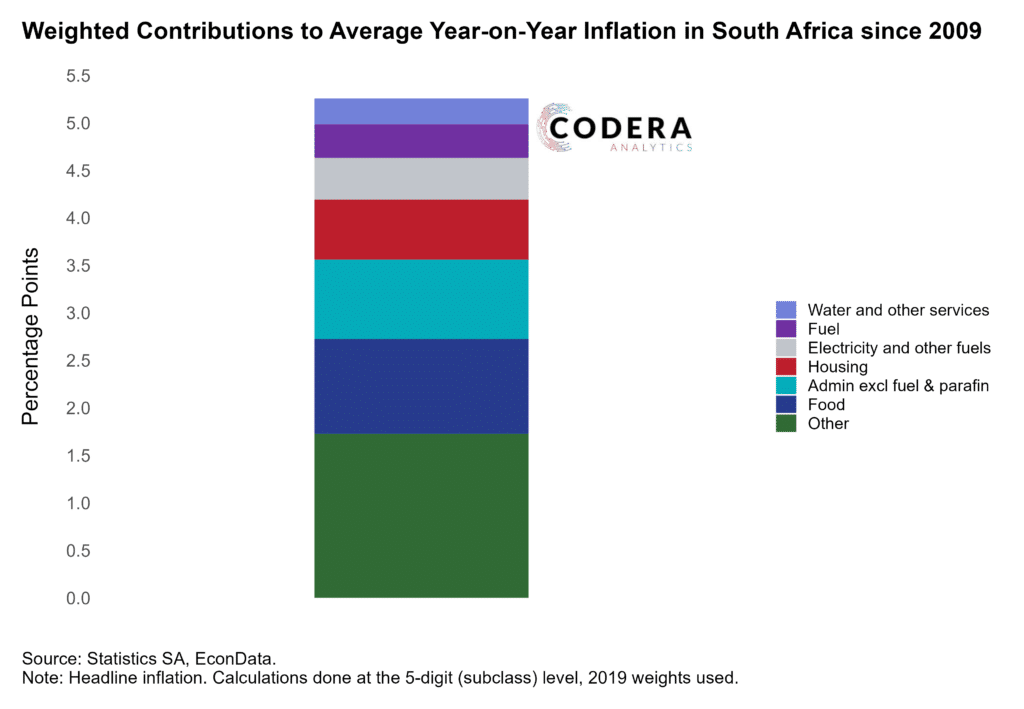
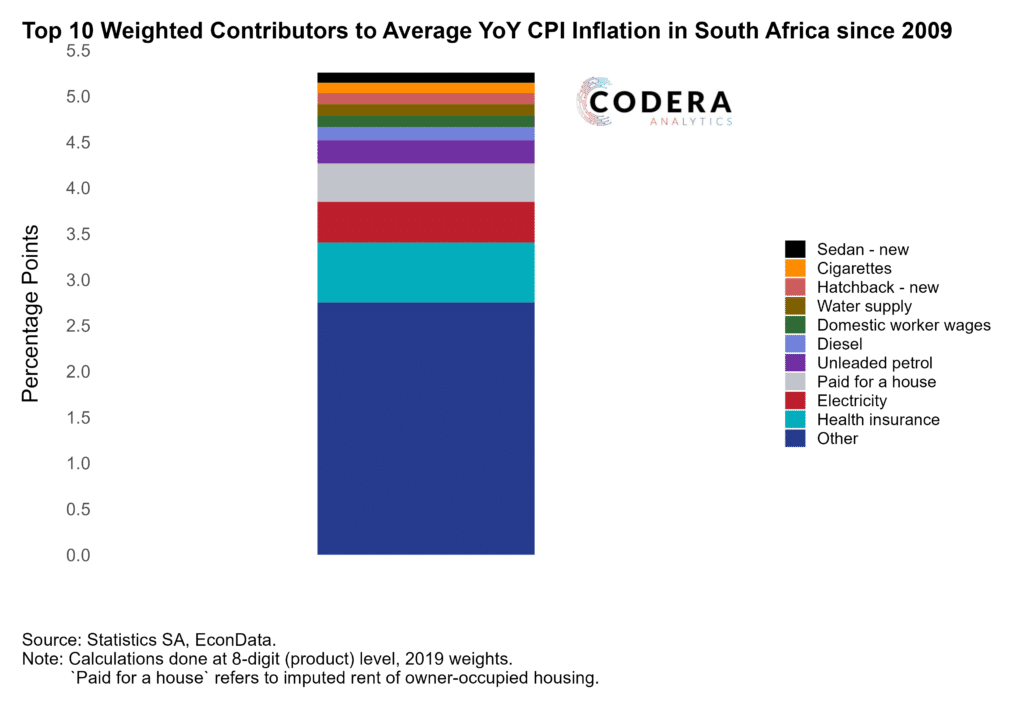
Today’s post compares the weighted contributions of different components of the consumer basket at different levels of disaggregation. The charts below compare the weighted contributions of different components of the consumer basket at different levels of disaggregation. At a 2-digit level, the largest contributors have been housing and utilities and food and non-alcoholic beverages (NAB) to the average headline inflation since 2009 of around 5.3%. At 5-digit level, administrative prices is the largest combined component at 1.2 percentage points (electricity and other fuels at 0.45, fuel at 0.35, water and other services at 0.25), food at 1 percentage points, followed by housing at approximately 0.65 percentage points (owner-occupied housing at 0.5 plus tenant rent at 0.15). Lastly at 8-digit level, the weighted contribution of health insurance is the largest single component, followed by electricity, owner occupied housing, and then petrol and diesel. Categories such as cigarettes and car prices also feature in the top 10 contributors to headline inflation.
Historical CPI weights back to 1970 are available on our EconData platform to enterprise subscribers. As far as we are aware, EconData is only source of these historical weights. Get in touch for a demo.
Compiled by Lisa Martin